
Markets entered the new week with historic volatility. Gold breached $5,000 while Bitcoin broke critical support. The US Dollar Index collapsed to 97.03.
Today’s market update covers all major asset classes. You get actionable trading levels for currencies, commodities, cryptocurrencies, and equities. Plan your trades across multiple markets.
Contact us for personalized multi-market trading strategies:
- WhatsApp: +923408747609
- Email: admin@pipsjournal.tech
This comprehensive analysis helps Pakistan traders navigate complex market conditions. We break down what’s moving markets and why. Use this information to make informed trading decisions.
Access our complete suite of Forex Trading Calculators to plan your positions accurately.
Market Overview: Historic Monday Trading Session
Monday January 26th delivered extraordinary price action across asset classes. Safe-haven assets surged while risk assets struggled. Capital rotation accelerated from crypto into precious metals.
The key theme: uncertainty drives flows into tangible assets. Geopolitical tensions, currency concerns, and policy uncertainty create perfect conditions for gold and silver. Digital assets suffer as investors prefer physical stores of value.
Let’s examine each major market systematically. Understanding correlations between markets improves trading decisions dramatically.
Foreign Exchange Markets: Dollar Crisis Deepens
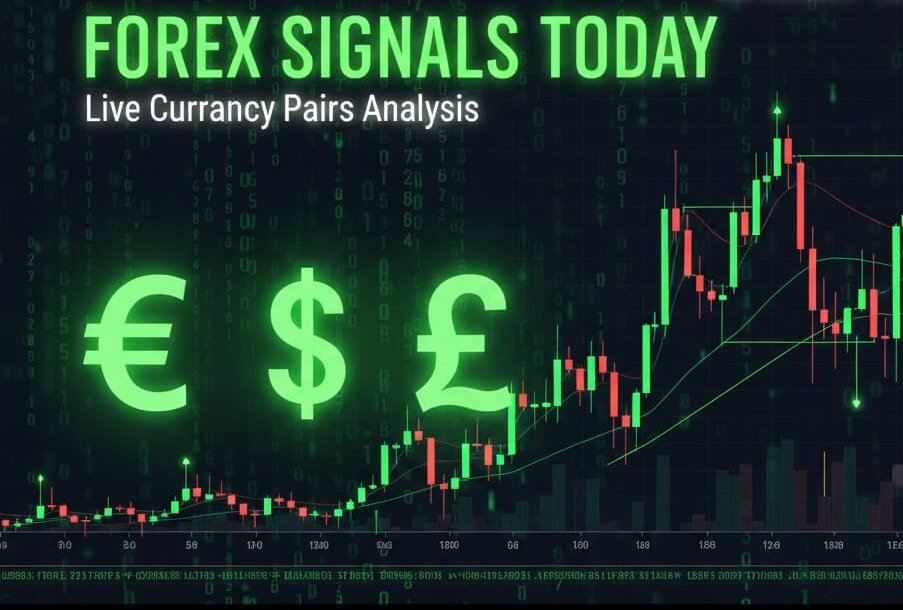
Currency markets dominated headlines Monday. The US Dollar Index suffered its worst single-day decline in months. Multiple factors converge to pressure the world’s reserve currency.
US Dollar Index (DXY) – Technical Breakdown
DXY fell 0.6% to 97.03, extending last week’s brutal 2% decline. Technical indicators flash warning signals. The 50-day simple moving average crossed below the 200-day SMA—the infamous “death cross.”
Death crosses signal long-term bearish momentum. While not infallible, they carry significant weight. Combined with fundamental dollar weakness from policy uncertainty, the signal gains credibility.
Key technical levels for DXY:
- Immediate Support: 97.00 psychological level. Break below accelerates dollar weakness.
- Critical Support: 96.50 marks multi-month low. This level must hold to prevent dollar collapse.
- Resistance: 98.50 represents reclaim zone. Above this, dollar stabilizes temporarily.
For traders, dollar direction determines gold prices, commodity values, and emerging market currency strength. Watch DXY obsessively this week.
EUR/USD – Euro Strength Surprises
EUR/USD broke decisively through 1.1900 to reach its highest level since mid-September. The pair gained 0.63% Monday despite disappointing German economic data.
German Ifo Business Climate Index came in at 87.6, showing continued weakness in Europe’s largest economy. Normally this would pressure the euro. Instead, broad dollar selling overwhelms Eurozone fundamentals.
Trading Levels for EUR/USD:
- Current Price: 1.1900
- Immediate Resistance: 1.1950 – 1.1970 zone where profit-taking emerges
- Major Resistance: 1.2000 psychological barrier. Breaking this opens path to 1.2150.
- Support: 1.1800 represents breakout level. Price must stay above to maintain bullish structure.
- Stop Loss Level: 1.1750 for long positions entered this week.
Trade Setup: Buy pullbacks to 1.1850 with stops below 1.1800. Target 1.2000 initially, then 1.2100. Risk-reward favors euro longs currently.
GBP/USD – Sterling Reaches Six-Month Highs
Cable touched 1.3671, marking its best exchange rate since late July 2025. Like EUR/USD, sterling benefits from dollar weakness rather than UK strength.
UK inflation remains elevated at 3.4%, well above Bank of England’s 2% target. This typically pressures currencies. But dollar weakness dominates all other factors.
GBP/USD Trading Plan:
- Support Zone: 1.3550 – 1.3580 offers buying opportunities
- Resistance: 1.3700 psychological level, then 1.3800 major
- Stop Loss: Below 1.3500 for new long positions
- Target: 1.3850 if dollar weakness continues
UK economic data remains weak. Don’t overlook fundamentals completely. Trade with appropriate risk controls and tighter stops than usual.
USD/JPY – Intervention Fears Trigger Collapse
USD/JPY experienced Monday’s most dramatic move. The pair collapsed from 159.00 to below 154.00 in hours. Markets suspect coordinated intervention warnings from Federal Reserve and Bank of Japan.
Central banks conduct “rate checks” before actual intervention. Rate checks involve calling dealers to ask about current market rates. This signals official concern about exchange rate levels.
Japan’s Ministry of Finance and BoJ have history of intervening to prevent excessive yen weakness. The 160.00 level appears to be their pain threshold. Traders positioned short yen scrambled to cover, accelerating the move.
USD/JPY Strategy:
- Avoid Long Positions: Intervention risk remains extremely high above 155.00
- Potential Short Setup: Rallies toward 156.00-157.00 offer shorting opportunities
- Stop Loss: Tight stops at 158.00 due to intervention unpredictability
- Target: 152.00 and possibly 150.00 if intervention occurs
This pair trades more on official policy than market forces currently. Respect the authorities’ ability to move markets against you.
Use our Currency Converter to calculate profit/loss across multiple currency pairs efficiently.
Cryptocurrency Markets: Bitcoin Breaks Key Support
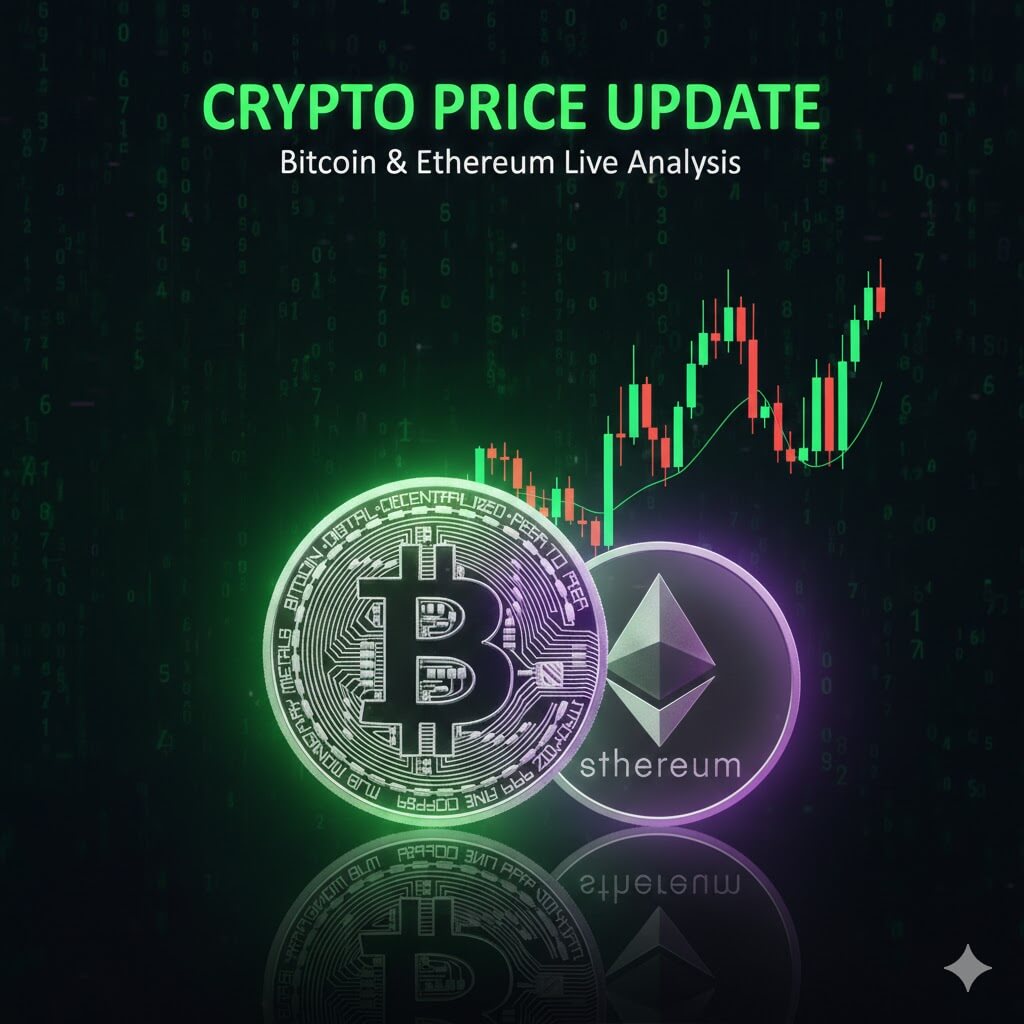
Cryptocurrency markets faced heavy selling pressure Monday. Bitcoin broke critical technical support while altcoins followed lower. The “risk-off” market environment punishes speculative assets.
Bitcoin (BTC) – Support Failure Signals Trouble
Bitcoin fell below $88,000 support level that held for weeks. Intraday lows touched $86,000 before minor bounce to current $87,200 area.
The breakdown carries significant technical weight. $88,000 represented the floor from early January consolidation. Breaking this floor opens deeper downside potential.
Why Bitcoin Underperforms:
Capital rotation explains much of the weakness. Investors selling Bitcoin to buy gold and silver. When safe-haven demand dominates, digital assets suffer. Gold offers tangibility that crypto cannot.
Spot Bitcoin ETF outflows totaled over $1.7 billion in the past week. This institutional selling pressure weighs heavily. When BlackRock’s ETF sees redemptions, retail traders take notice and sell too.
Regulatory concerns resurface. Multiple countries discuss tighter crypto regulations throughout 2026. This creates overhead resistance that precious metals don’t face.
Bitcoin Trading Levels:
- Critical Support: $84,200 is the make-or-break level. Failure here opens $74,000-$80,000 downside.
- Resistance: $88,000 now flips from support to resistance. Reclaiming this level required for stabilization.
- Major Resistance: $92,000 and $95,000 represent overhead supply zones.
Trading Strategy: Wait for clear bottom formation before buying Bitcoin. Currently, the trend remains bearish. Don’t try catching falling knives. Let price stabilize and form higher low before considering long positions.
Ethereum (ETH) – Struggling Below $3,000
Ethereum fell 2.9% to approximately $2,858. The psychological $3,000 level remains elusive despite multiple tests. Each failure to break above reduces buying enthusiasm.
ETH shows relative weakness compared to Bitcoin. The ETH/BTC ratio declines, indicating Ethereum underperforms even as both fall. This relative weakness concerns long-term holders.
Ethereum Levels:
- Support: $2,750 – $2,800 zone provides floor currently
- Major Support: $2,500 marks next significant level if current support fails
- Resistance: $3,000 psychological barrier, then $3,200
Avoid Ethereum until it reclaims $3,000 decisively. The failed breakout attempts suggest accumulation incomplete. Better opportunities exist elsewhere currently.
XRP – Trendline Break Signals Weakness
XRP broke below its ascending trendline from December. Trading under $1.90 now, downside risk extends toward $1.69 support zone.
The trendline break qualifies as bearish development. XRP enjoyed strong performance in late 2025 on regulatory optimism. That optimism fades as price action deteriorates.
Avoid XRP until stabilization occurs. Wait for clear reversal pattern before considering long positions. Many altcoins show better relative strength currently.
Cryptocurrency Market Outlook:
The crypto market needs time to find bottom. Technical damage is significant. Bitcoin’s failure at $88,000 requires repair before sustainable rally emerges.
For traders: focus on stronger markets like gold and silver currently. Return to crypto when technical conditions improve and risk appetite returns. Fighting the trend in crypto proves expensive.
Commodity Markets: Energy and Metals Diverge

Commodity markets show mixed performance. Precious metals hit records while energy faces supply concerns. Understanding these divergences creates trading opportunities.
Crude Oil – Weather Support Versus Supply Reality
WTI crude settled near $60.63 Monday, up 3% on the week. Brent traded around $65.88, gaining 2.84%. Winter Storm Fern provided temporary price support.
The storm knocked out 10% of US oil production temporarily. Refineries in Texas and Louisiana shut down as precaution. Over 750,000 customers lost power, primarily in southern states.
However, medium-term fundamentals remain bearish. The Energy Information Administration forecasts WTI averaging $52 per barrel through 2026. The reason: global supply surplus.
Non-OPEC production, especially from Americas, continues ramping. The EIA projects surplus of 4.25 million barrels per day in Q1 2026. OPEC+ struggles to maintain market share amid this flood of supply.
Crude Oil Trading Strategy:
- Sell Rallies: Any move toward $62-$63 (WTI) offers attractive short opportunities
- Target: $58-$55 range as supply fundamentals reassert
- Stop Loss: Above $64 to protect against geopolitical surprises
- Risk: Middle East tensions could spike prices quickly
Trade crude with tight risk controls. Geopolitical events can gap markets violently overnight.
Natural Gas – Freeze Sends Prices Soaring
US Natural Gas futures surged above $6.00, marking a 4-year high. Winter Storm Fern created legitimate heating demand surge as temperatures plunged.
The freeze impacted Henry Hub distribution, the key natural gas pricing point. Production facilities experienced freeze-offs, reducing immediate supply. Heating demand spiked simultaneously.
However, this represents temporary dislocation. As March approaches and heating season ends, demand falls. Current prices likely represent short-term peak.
Natural Gas Strategy: Consider taking profits on long positions established earlier. The seasonal demand spike is real but temporary. Prices likely decline significantly by April.
Copper – The Forgotten Metal in Precious Metals Rally
While gold and silver make headlines, copper quietly strengthens. The industrial metal trades near $5.77/lb, up modestly on the week.
Copper offers interesting value play. The metal essential for electrical applications in AI data centers, renewable energy infrastructure, and electric vehicles. Demand fundamentals remain strong.
Some analysts suggest copper could be “next big trade” after precious metals consolidate. Consider copper mining stocks (FCX, SCCO) as value catch-up play versus overextended gold and silver.
Stock Market Analysis: Tech Earnings Week Begins
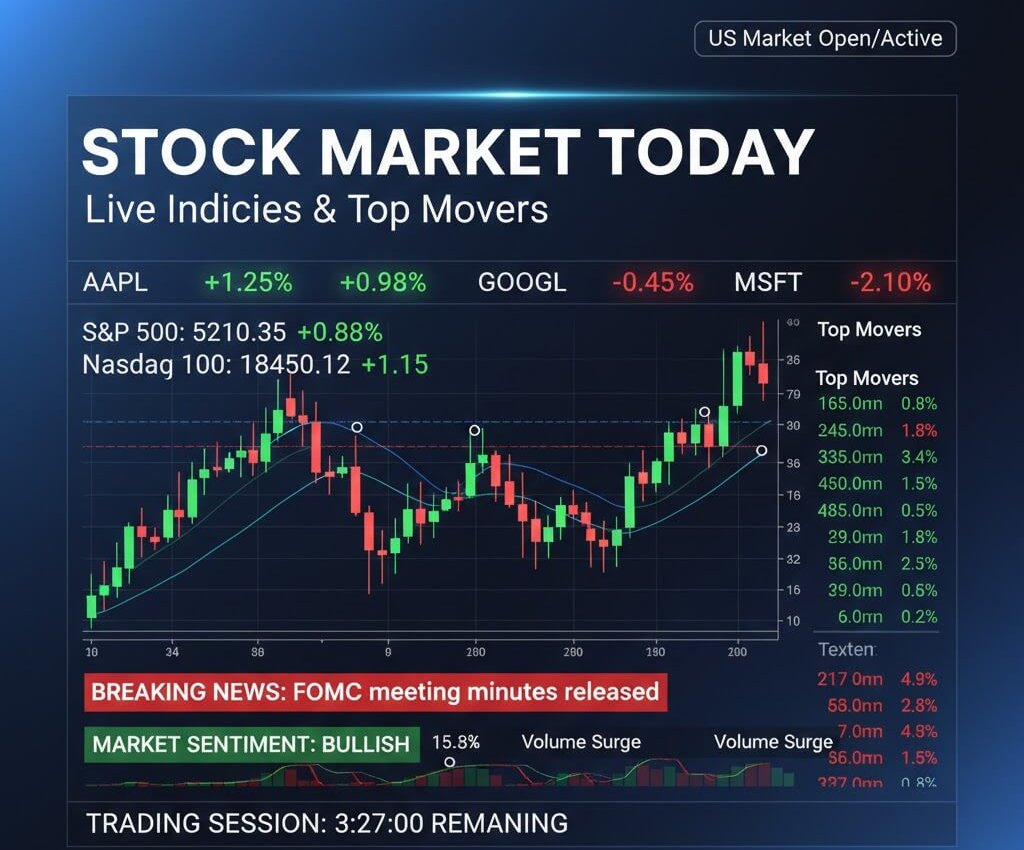
US equity markets posted modest gains Monday despite mixed sector performance. Investor attention shifts to major technology earnings this week.
Major Index Performance:
- S&P 500: +0.5% to 6,950.23
- Dow Jones: +0.6% to 49,412.40
- Nasdaq: +0.3% (tech-heavy index underperforms)
The “Magnificent 7” technology companies report earnings this week. Tesla, Microsoft, Apple, and Meta all announce results before Friday. These companies carry enormous index weight. Their performance determines broader market direction.
Individual Stock Movers:
Winners:
- CoreWeave (+6.3%): Surged on $2 billion investment from Nvidia. AI infrastructure stocks attract capital despite broader uncertainty.
- USA Rare Earth (+7.9%): Jumped following announcement of $1.6 billion federal funding. Strategic mineral companies benefit from government reshoring initiatives.
- Nvidia: Stable near highs as AI spending continues. The company’s CoreWeave investment signals confidence in data center buildout.
Losers:
- Intel (-5.7%): Dropped on soft forward guidance. Chipmaker faces intense competition and margin pressure from AMD and Nvidia.
- The Trade Desk (-8.0%): Fell after CFO departure announcement. Leadership changes spook investors, especially in growth companies.
- Regional Banks: Weakness across sector on interest rate concerns and dollar instability.
Sector Analysis:
Technology: Mixed performance ahead of earnings. AI-related names strong; legacy tech weak. Nvidia ecosystem benefits while general semiconductors struggle.
Financials: Pressure from dollar weakness and rate cut expectations. Banks typically underperform when yield curve flattens and rates fall.
Energy: Gains on crude oil strength. However, fundamental supply concerns limit upside for energy stocks.
Materials: Precious metal miners surge on gold/silver rally. Industrial metals companies lag.
Stock Market Trading Strategy:
Reduce equity exposure before major tech earnings Wednesday-Friday. Earnings create binary outcomes—stocks gap violently up or down. Protecting capital matters more than catching potential upside.
After earnings, identify individual opportunities based on results and guidance. Company-specific factors will dominate sector trends temporarily.
Consider gold mining stocks as alternative equity exposure. These benefit from metal price strength with lower correlation to tech earnings volatility.
Federal Reserve Decision Wednesday: Market Implications
The FOMC announces its rate decision Wednesday, January 28th at 2:00 PM EST. The decision itself holds little suspense—no rate change expected. Rates remain at 3.50%-3.75%.
However, Chairman Powell’s statement and press conference create significant market-moving potential. Traders will parse every word for clues about future policy direction.
Key Questions Markets Want Answered:
1. Does the Fed Acknowledge Dollar Weakness?
DXY fell 2% last week. If Powell expresses concern, that could provide temporary dollar support. However, Fed typically avoids direct commentary on exchange rates. Unlikely to be prominently addressed.
2. What’s the Rate Cut Timeline?
Markets currently price two rate cuts by December 2026. Any hint of earlier cuts weakens dollar further, boosting gold and pressuring it temporarily if Powell maintains “higher for longer” stance.
3. How Does Fed View Inflation Trajectory?
Recent data shows cooling inflation. But Trump’s tariff threats could reignite price pressures. If Fed acknowledges tariff inflation risk, gold benefits. If Fed declares victory on inflation, gold might consolidate.
4. What About Geopolitical Impacts on Economy?
Trade tensions with Canada, tariff threats against Europe, and general policy uncertainty affect business confidence. Will Powell address these risks to economic outlook?
Market Reactions to Consider:
Hawkish Fed (Less Likely):
- Dollar bounces temporarily
- Gold pulls back $30-50
- Stocks sell off on rate cut delays
- Long-term bond yields rise
Dovish Fed (More Likely):
- Dollar extends decline
- Gold rallies $50-100
- Stocks rally on rate cut hopes
- Bond yields fall
Neutral/Balanced Fed (Most Likely):
- Initial volatility then return to prevailing trends
- Markets likely interpret as mildly dovish given dollar weakness
- Gold consolidates current gains
Trading the Fed Announcement:
Conservative Approach: Close 50-75% of positions before announcement. Wait for volatility to settle. Re-enter based on new technical levels after clarity emerges. Sacrifices potential profit for safety.
Aggressive Approach: Use bracket orders with buy stops above resistance and sell stops below support. Let market choose direction. Ride momentum once breakout occurs. Requires quick decisions and strict discipline.
Critical Rule: Don’t chase initial move. Fed announcements often see violent reversals within 30-60 minutes. Wait for confirmation of direction before committing large position sizes.
Economic Calendar: Key Data This Week
Multiple high-impact economic releases occur this week. Plan trading around these events to avoid unnecessary volatility exposure.
Wednesday, January 28:
- FOMC Rate Decision (2:00 PM EST): Expected hold at 3.50%-3.75%. Statement and press conference at 2:30 PM create volatility across all markets.
- ADP Employment Report (8:15 AM EST): Private sector job growth indicator. Strong number supports dollar temporarily.
Thursday, January 29:
- US GDP Preliminary (8:30 AM EST): Q4 2025 growth estimate. Consensus expects 2.7% annualized. Strong data supports dollar; weak data pressures it.
- Eurozone GDP (5:00 AM EST): Q4 growth for EU economy. Important for EUR/USD direction alongside dollar factors.
- Jobless Claims (8:30 AM EST): Weekly unemployment insurance claims. Indicator of labor market health.
Friday, January 30:
- US Core PCE Price Index (8:30 AM EST): Fed’s preferred inflation gauge. This might be week’s most important data point. Determines rate cut timeline expectations.
- Personal Income and Spending (8:30 AM EST): Consumer health indicators. Strong spending supports economic growth narrative.
- Employment Cost Index (8:30 AM EST): Wage inflation measure. Important for Fed policy considerations.
Data Trading Strategy:
Reduce position sizes before major data releases. Use 50% of normal size if trading through announcements. Better yet, step aside completely during volatile events.
After data releases, wait 5-10 minutes for knee-jerk reactions to complete. Initial moves often reverse. Enter trades after seeing how market digests information.
Friday afternoon ahead of weekend brings additional risk. Consider taking partial profits before market close. Weekend gaps can work against unprotected positions.
Geopolitical Update: Tensions Ease but Risks Remain
Geopolitical developments drove much of Monday’s market action. Understanding these risks helps anticipate future volatility.
Greenland Crisis Resolution:
Trump and NATO Secretary-General Mark Rutte reached “framework of future deal” at Davos summit. The agreement focuses on Arctic security partnership—dubbed “Arctic Sentry”—rather than sovereignty transfer.
Trump withdrew threats of 25% tariffs on EU nations. This de-escalation provided relief across markets. EUR/USD rallied immediately on the news.
However, the crisis demonstrated how quickly geopolitical tensions can emerge. Trust between US and European allies suffered damage. This elevates background risk premium in markets.
Canada-China-US Triangle:
Trump threatened 100% tariffs on Canadian goods if Canada finalizes comprehensive trade deal with China. Canadian Prime Minister Carney denies pursuing full free trade agreement but acknowledges ongoing trade discussions.
This situation remains fluid. Trump’s willingness to use extreme tariff threats as negotiating tool creates constant uncertainty. Markets hate uncertainty.
Middle East Stability:
Relative calm in Middle East provides relief. However, underlying tensions between Iran, Israel, and regional powers remain. Any escalation sends oil prices sharply higher and benefits safe-haven gold.
Russia-Ukraine War:
Conflict enters third year with no resolution visible. While markets largely desensitized to ongoing fighting, risk of escalation always exists. NATO involvement would trigger significant market disruption.
Trading Geopolitical Risk:
Maintain some gold exposure as portfolio insurance. Even small allocations (5-10% of portfolio) provide protection against sudden geopolitical shocks.
Avoid overleveraging any single position. Geopolitical events create gaps and violent moves. Proper position sizing prevents account damage from unexpected news.
Stay informed through reliable news sources. False reports and rumors move markets temporarily. Verify information before trading news events.
Market Correlation Analysis
Understanding how different markets relate improves trading decisions dramatically. Strong correlations allow using one market to predict another.
Gold and Dollar (Strong Inverse):
Gold and DXY trade with -0.85 correlation approximately. When dollar falls, gold rises almost mechanically. This relationship is trading’s most reliable correlation.
Current dollar weakness to 97.03 directly drives gold to $5,000+. If DXY breaks below 97.00, expect gold acceleration toward $5,200. Conversely, any dollar bounce above 98.50 pressures gold.
Trading Application: Use DXY as leading indicator for gold trades. Dollar showing weakness at support? Enter gold longs. Dollar bouncing at resistance? Take gold profits.
Gold and Real Yields (Strong Inverse):
Gold competes with interest-bearing assets. When real yields (nominal yields minus inflation) rise, gold becomes less attractive. When real yields fall, gold shines.
Current environment: nominal yields falling while inflation expectations stable. This reduces real yields, benefiting gold directly.
Bitcoin and Risk Appetite (Strong Positive):
Bitcoin correlates with risk-on sentiment. When investors embrace risk, crypto rallies. When fear dominates, crypto falls.
Current risk-off environment explains Bitcoin’s breakdown. As long as geopolitical uncertainty persists, crypto faces headwinds. Risk appetite return required for sustained Bitcoin rally.
Oil and Refining Stocks (Positive but Lagged):
Crude oil prices influence refining company profits with 1-2 month lag. Current oil strength benefits refiners in coming weeks.
However, current oil rally is weather-driven temporary spike. Don’t overweight refining stocks based on short-term oil moves.
EUR/USD and European Stocks (Positive):
Euro strength typically benefits European equity markets. Stronger currency indicates confidence in region’s economy.
Current EUR/USD rally driven by dollar weakness rather than Eurozone strength. This limits positive impact on European stocks.
Key Takeaway: Always consider correlations. Don’t trade markets in isolation. One market’s movement provides clues about others.
Risk Management for Multi-Market Trading
Trading multiple markets simultaneously requires careful risk management. Correlations can amplify losses if not managed properly.
Portfolio Heat Management:
Total portfolio risk should never exceed 6-8% across all open positions. If you’re long gold (2% risk), long EUR/USD (2% risk), and short USD/JPY (2% risk), you’re at 6% total.
However, these positions all bet against the dollar. If dollar unexpectedly rallies, all three positions lose simultaneously. Your actual risk is higher than 6%.
Solution: Reduce position sizes when trades correlate highly. If running three anti-dollar positions, reduce each to 1.5% risk for 4.5% total. This accounts for correlation risk.
Sector Diversification:
Don’t concentrate all trades in one market area. Spread risk across:
- Foreign exchange (currency pairs)
- Precious metals (gold, silver)
- Energy (crude oil, natural gas)
- Cryptocurrencies (when trend favorable)
- Equities (individual stocks or indices)
Diversification across uncorrelated or negatively correlated markets reduces portfolio volatility while maintaining return potential.
Time Diversification:
Don’t enter all positions simultaneously. Scale into positions over time. This improves average entry prices and reduces risk of entering at worst possible moment.
Example: Want to build 4% position in gold? Enter 1% now, 1% if gold dips to $5,000, 1% more at $4,950, final 1% at $4,900. This creates better average cost basis.
Stop Loss Coordination:
Place stops at technical levels, not arbitrary distances. Review all stops daily. Move stops to breakeven on profitable positions. This locks in gains and reduces overall portfolio risk.
Use our Risk Reward Calculator to evaluate each trade’s potential before entering.
Trading Plan for This Week
Here’s specific actionable plan for next five trading days. Adjust based on your risk tolerance and account size.
Monday-Tuesday (Jan 27-28 Morning):
Focus: Position building in trending markets with reduced size ahead of Fed.
- Gold: Look for entries near $5,000 or $4,950 on pullbacks. Target $5,150-$5,180. Stop at $4,915.
- EUR/USD: Buy dips to 1.1850 area. Target 1.2000. Stop at 1.1750.
- Crude Oil: Short rallies to $62-63. Target $58-55. Stop at $64.50.
- Bitcoin: Avoid until stabilization above $88,000. No trades currently.
Wednesday (Jan 28 – Fed Day):
Pre-Announcement (Before 2 PM EST):
- Close 50% of all positions. Book partial profits.
- Move stops to breakeven on remaining positions.
- Reduce leverage by 50%.
- Set alerts at key technical levels but don’t place orders.
Post-Announcement (After 2:30 PM EST):
- Wait 30-60 minutes for volatility to settle.
- Identify new support/resistance based on post-Fed trading.
- Enter fresh positions based on new market structure.
- Use reduced size (50% normal) for Fed day entries.
Thursday-Friday (Jan 29-30):
Focus: Data trading and weekend position management.
- Trade GDP and PCE data with reduced size.
- Book partial profits Friday afternoon ahead of weekend.
- Run 50% of positions through weekend maximum.
- Review week’s performance and plan next week.
Daily Routine:
- 8:00 AM PKT: Review overnight moves, check economic calendar, read market news.
- 1:00 PM PKT: London session opens. Main trading window. Execute planned trades.
- 7:00 PM PKT: New York session active. Monitor positions, adjust stops.
- 11:00 PM PKT: Review day’s results. Plan tomorrow’s trades. Set overnight alerts.
Consistency matters more than intensity. Follow same routine daily. Build discipline through repetition.
Final Thoughts: Navigate Historic Market Conditions
This week presents both extraordinary opportunity and significant risk. Gold at $5,000+, dollar at multi-month lows, Bitcoin breaking support—markets are in flux.
Success requires discipline, patience, and systematic risk management. Don’t chase every move. Wait for price to reach your levels. Better to miss trades than take bad ones.
The Fed decision Wednesday creates binary event risk. Prepare for volatility. Reduce exposure if uncomfortable with uncertainty. Capital preservation always comes first.
Focus on highest-probability setups in strongest trends. Gold remains the clear leader currently. EUR/USD shows strength. Crude oil offers counter-trend shorts. Bitcoin requires patience.
Remember that trading is marathon, not sprint. Consistent small profits compound into large returns. One home run trade isn’t the goal—consistent base hits are.
Markets will be here tomorrow, next week, next year. Don’t risk everything on one week’s trading. Protect capital. Stay in the game. Long-term success follows.
For comprehensive market updates and live trading signals across all asset classes:
- WhatsApp: +923408747609
- Email: admin@pipsjournal.tech
- Website: pipsjournal.tech
Trade safely. Manage risk carefully. Success will follow discipline.
Read More Analysis
Looking for detailed analysis of specific markets? Check our specialized category pages:
Subscribe to our newsletter for comprehensive market analysis delivered to your inbox every morning at 8 AM Pakistan time.