
Support and resistance trading is one of the most powerful techniques you can learn as a beginner trader. This strategy helps you identify where prices are likely to stop, reverse, or break through. Understanding these key levels gives you a solid foundation for making smart trading decisions in forex, stocks, and other markets.
This guide teaches you everything about support and resistance zones. You will learn how to spot them, draw them correctly, and use them to make profitable trades.
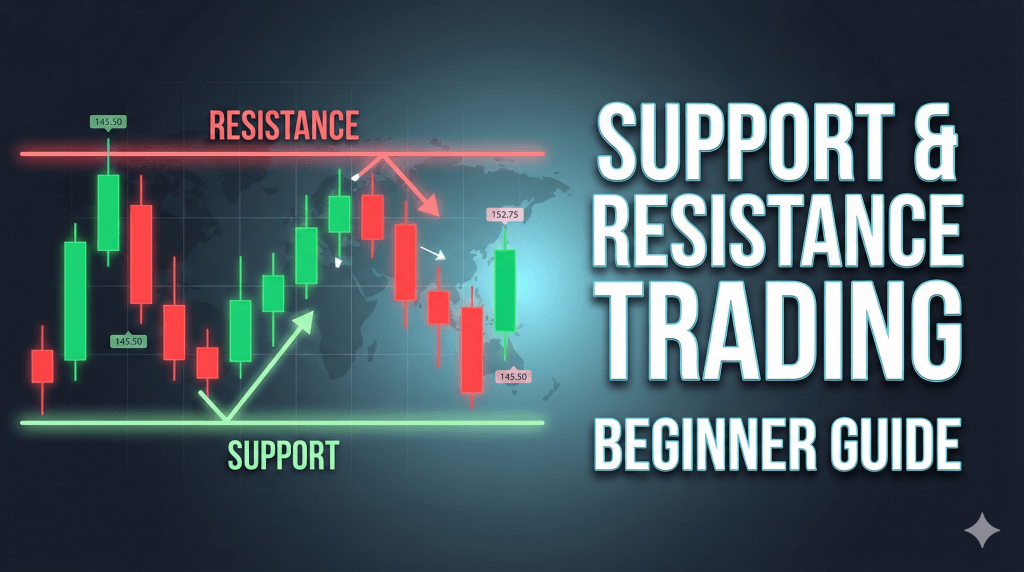
What Are Support and Resistance Levels
Support and resistance are price levels where markets tend to pause or change direction. These invisible barriers form when many traders place orders at similar price points.
Support is a price level where buying pressure stops prices from falling further. Think of it like a floor that catches the price when it drops. When price reaches support, buyers step in and push it back up.
Resistance is a price level where selling pressure stops prices from rising higher. This acts like a ceiling that blocks upward movement. When price hits resistance, sellers take control and push it back down.
These levels work because of trader psychology. When price bounces at a level multiple times, more traders notice it. They place orders at that same level, making it stronger.
Why Support and Resistance Matter for Pakistani Traders
Pakistani traders can use support and resistance on any trading platform. Whether you trade EUR/USD, gold, or Bitcoin, these levels appear everywhere. Learning this skill helps you trade smarter with less risk.
Price action at these levels gives you clear entry and exit points. You know exactly where to place your trades and where to set stop losses. This removes guesswork from your trading decisions.
Support and resistance work on all timeframes. Day traders use 15-minute charts while swing traders prefer daily charts. The same principles apply to both styles. This makes it a versatile strategy for any trading approach.
If you are new to trading in Pakistan, check out our complete guide on how to start forex trading. It covers broker selection, account setup, and legal requirements for Pakistani traders.
How to Identify Support Levels
Support levels form where price stops falling and bounces back up. You can spot these by looking at chart history. Find areas where price touched a low point and reversed higher multiple times.
The simplest way to find support is by looking for swing lows. These are the bottom points before price moves back up. Connect at least two or three swing lows with a horizontal line. This creates your support level.
Price often returns to test old support levels. When it does, watch how price reacts. A strong bounce confirms the support is still valid. A clean break below signals the support has failed.
Support becomes stronger when price tests it multiple times without breaking. However, too many tests can weaken it. Each test uses up buying orders at that level. Eventually, those orders get filled and the support breaks.
How to Identify Resistance Levels
Resistance levels form where price stops rising and falls back down. These appear at swing highs on your charts. Look for peaks where price reached a high point before dropping.
Draw resistance by connecting two or more swing highs with a horizontal line. This shows where sellers previously took control. When price approaches this level again, sellers often return.
Old resistance can become new support after a breakout. When price breaks above resistance and closes above it, that level flips. The former ceiling becomes the new floor. This concept is called a role reversal.
You can see these patterns clearly on Pakistani trader-friendly currency pairs. Major pairs like EUR/USD and GBP/USD show clean support and resistance levels that are easy to identify.
The Difference Between Levels and Zones
Many beginners make the mistake of treating support and resistance as exact lines. In reality, they work better as zones or areas. Price rarely respects a precise number down to the pip.
Support and resistance zones account for market noise. Prices might spike through your line by a few pips before reversing. Using zones instead of lines helps you avoid false breakouts.
A zone is typically 10 to 20 pips wide on major pairs. Draw a rectangle around the area where price has reacted multiple times. This gives you a buffer for entries and stop losses.
Zones reflect how real markets behave. Professional traders place orders in clusters around key levels, not at one exact price. Your zones should capture where most of this order flow sits.
How to Draw Support and Resistance Correctly
Start by zooming out on your chart. Look at the bigger picture first. The most important levels are visible from a distance. If you need to squint to see a level, it is not significant enough.
Focus on obvious levels only. Draw lines where price has made strong reactions. Look for decisive candles with long wicks showing rejection. These signal that buyers or sellers fought hard at that level.
Connect your lines to candle closes, not wicks. Wicks show temporary price spikes that often reverse quickly. Candle closes represent where price actually settled. This gives you more reliable levels.
Limit yourself to 3 or 4 key levels per chart. Too many lines create confusion. Your chart should look clean and easy to read. Draw only the levels that have proven themselves multiple times.
Use higher timeframes for stronger levels. Daily and weekly charts show more significant zones than 5-minute charts. Start your analysis on the 4-hour or daily chart, then zoom into lower timeframes for precise entries.
Trading the Bounce Strategy
The bounce strategy is the most straightforward way to trade support and resistance. You wait for price to reach a key level, then trade the reversal. This works best in ranging markets.
When price approaches support, wait for confirmation before buying. Do not place orders directly at the support line. Watch for a bullish candle pattern like a pin bar or engulfing candle. This confirms buyers are stepping in.
Place your stop loss just below the support zone. If support breaks, you exit with a small loss. Your take profit should target the next resistance level. This gives you a good risk-reward ratio.
For resistance trading, the process reverses. Wait for price to reach resistance, look for bearish confirmation, then sell. Place stops above resistance and target the next support level.
Never trade blindly at levels. Always wait for price action confirmation. A simple rule is to enter only after a candle closes in your favor. This reduces false signals and improves your win rate.
Trading the Breakout Strategy
Breakouts happen when price moves through a key level with strong momentum. These moves often lead to significant trends. Trading breakouts can be very profitable when done correctly.
A valid breakout needs two things. First, price must close beyond the level, not just spike through it. Second, you want to see increased volume during the break. This shows real buying or selling pressure.
Wait for a retest after the breakout. Price often returns to test the broken level before continuing. This retest gives you a safer entry point. Enter when price bounces from the old resistance turned new support.
Place your stop loss on the opposite side of the broken level. If price returns through the level, the breakout failed. Your take profit should be at least twice your stop loss distance.
False breakouts are common. Price might spike through a level, trigger stops, then reverse back. This is why waiting for a close beyond the level protects you from these traps.
Using Multiple Timeframes
Multiple timeframe analysis improves your trading accuracy. Start with a higher timeframe to see the overall trend. Then move to a lower timeframe for precise entry timing.
Use the daily chart to identify major support and resistance zones. These levels carry more weight than levels on smaller timeframes. Daily levels represent where big money places orders.
Switch to a 4-hour or 1-hour chart for trade execution. Look for the same levels you marked on the daily chart. When price approaches these zones on lower timeframes, watch for entry signals.
Higher timeframe levels often hold better than lower timeframe levels. A daily support level is more likely to cause a bounce than a 15-minute support level. Always respect higher timeframe zones.
This approach works well with the best trading times for Pakistani traders. Plan your trades on higher timeframes during your free time, then execute during active market hours.
Common Mistakes Beginners Make
Drawing too many lines is the biggest mistake. Your chart becomes cluttered and confusing. Stick to the most obvious levels only. If you have more than 5 lines on your chart, remove the weaker ones.
Trading at the level without confirmation causes losses. Price might spike through your level before reversing. Wait for a candle to close in your direction before entering. Patience saves money.
Ignoring the overall trend reduces your success rate. Trading against the trend at support and resistance is harder. In an uptrend, focus on buying at support. In a downtrend, focus on selling at resistance.
Placing stops too tight leads to unnecessary losses. Give your trades room to breathe. Place stops beyond the zone, not right at the level. Markets need space to move without hitting your stop.
Expecting every level to hold is unrealistic. Support and resistance break sometimes. That is normal market behavior. Always use proper risk management. Risk only 1-2% of your account per trade.
Risk Management with Support and Resistance
Position sizing matters more than your entry point. Calculate how much you can risk before placing any trade. Never risk more than 2% of your account balance on a single trade.
Your stop loss distance determines your position size. Measure the pips from your entry to your stop loss. Use this to calculate the right lot size for your risk amount.
Risk-reward ratio should be at least 1 to 2. If you risk 50 pips, target 100 pips profit. This means you can lose more trades than you win and still make money overall.
Support and resistance give you natural stop loss levels. Place stops just beyond the zone you are trading. This logical placement protects you if the level breaks.
Move your stop to breakeven after price moves in your favor. When price reaches halfway to your target, move your stop to your entry price. This locks in a risk-free trade.
For detailed risk management strategies, read our complete forex trading guide. It covers position sizing, leverage management, and more advanced techniques.
Tools to Help You Trade Support and Resistance
MetaTrader 5 provides all the tools you need. The horizontal line tool lets you draw levels quickly. You can change colors to distinguish between support and resistance. Save your templates for quick chart setup.
TradingView offers superior charting tools. The drawing tools are more advanced than MT5. You can set alerts when price reaches your levels. This helps you monitor multiple pairs without watching charts constantly.
Economic calendars help you avoid trading during news events. Price often breaks through support and resistance during major news releases. Use Forex Factory or Investing.com to track upcoming events.
Position size calculators remove math errors. These tools tell you exactly what lot size to use based on your risk. MyFXBook calculators are free and accurate.
Price alerts keep you focused on the best setups. Set alerts at your key levels. When price approaches, you get notified. This saves time and helps you catch opportunities you might otherwise miss.
Practice Makes Perfect
Demo accounts let you practice without risking real money. Open a demo account with a regulated broker and practice drawing levels. Take trades based on support and resistance only.
Journal every trade you make. Write down why you entered, where you placed stops, and what happened. Review your journal weekly. Find patterns in your wins and losses.
Start with major currency pairs. EUR/USD and GBP/USD show cleaner support and resistance. These pairs have tight spreads and good liquidity. Practice on these before moving to exotic pairs.
Trade one strategy at a time. Master the bounce strategy before trying breakouts. Mixing strategies too early creates confusion. Give yourself at least 50 trades with one approach before changing.
Watch price action at your levels even when not trading. Observe how price reacts when it reaches support or resistance. This builds your intuition. You start seeing patterns you could not see before.
Combining Support and Resistance with Other Indicators
Moving averages add confluence to your trades. When a support level aligns with the 200-period moving average, it becomes stronger. Look for multiple factors supporting your trade idea.
RSI helps confirm oversold and overbought conditions. When price hits support and RSI shows oversold, it strengthens your buy signal. When price hits resistance and RSI shows overbought, it strengthens your sell signal.
Volume confirms the strength of your levels. High volume at support or resistance shows many traders are active. Low volume might mean the level is less significant.
Fibonacci retracement levels often align with support and resistance. When your drawn level matches a Fibonacci level, pay extra attention. This confluence increases the probability of a reaction.
Keep your charts simple even when adding indicators. One or two indicators maximum. Too many tools create conflicting signals. Support and resistance should remain your primary decision factor.
Real Trading Examples
Let us look at a typical bounce trade on EUR/USD. Price drops to a support level at 1.0800 that held three times before. You wait for a bullish pin bar to form at this level.
The pin bar closes above the support zone. This confirms buyers stepped in. You enter a buy trade at 1.0810, just above the pin bar close. Your stop loss goes at 1.0770, below the support zone.
Your target is the next resistance at 1.0900. This gives you a 90-pip profit target against a 40-pip stop loss. Your risk-reward ratio is 1 to 2.25. Price rises and hits your target two days later.
For a breakout trade, imagine GBP/USD testing resistance at 1.2500 multiple times. On the fourth test, price breaks above with a large bullish candle. Volume increases significantly during this move.
You wait for a retest. Price pulls back to 1.2500, which now acts as support. A bullish candle forms at this level. You enter at 1.2510 with a stop at 1.2470. Your target is 1.2590, giving you a 1 to 2 risk-reward.
These examples show how simple support and resistance trading can be. You do not need complicated indicators or systems. Clear levels, patience, and proper risk management are all you need.
Psychology of Support and Resistance Trading
Trading at key levels tests your patience. You might wait hours or days for price to reach your zone. New traders often get bored and take random trades. Discipline separates winners from losers.
Fear makes you exit good trades early. Price reaches your support level and bounces. But then it pulls back slightly. Fear kicks in and you close the trade. Then price continues to your target without you.
Greed makes you ignore your stop loss. Your trade goes against you. Instead of taking the loss, you hope it will reverse. This turns small losses into account-destroying losses. Always respect your stops.
Support and resistance remove emotion from trading. You have a plan before price arrives. You know your entry, stop, and target in advance. This reduces stress and improves decision making.
Successful traders wait for their setups. They do not force trades. Sometimes the best trade is no trade. Wait for price to come to your levels. Then execute your plan without hesitation.
Advanced Support and Resistance Concepts
Role reversal happens when support becomes resistance or resistance becomes support. After a breakout, the broken level often becomes the new barrier. This creates strong trading opportunities.
Dynamic support and resistance use moving averages or trend lines. These levels slope with the trend. The 200-period moving average often acts as dynamic support in uptrends and resistance in downtrends.
Multiple touches do not always mean stronger levels. Each touch uses up orders at that level. After several touches, the level might break easily. Fresh levels often hold better than tested ones.
Round numbers act as psychological support and resistance. Levels like 1.1000 or 1.2500 attract more attention. Traders place orders at these clean numbers. Factor this into your analysis.
Time-based support and resistance considers when levels form. A support level that formed recently is more relevant than one from years ago. Focus on levels created in the current market context.
Creating Your Support and Resistance Trading Plan
Write down your exact entry rules. Define what confirmation you need before entering. Specify which timeframes you will use. Detail how you will mark your levels.
Set your risk parameters. Decide your maximum risk per trade. Choose your preferred risk-reward ratio. Determine how many trades you will take per day or week.
Define your trading hours. Choose when you will analyze charts and when you will execute trades. Stick to the best times for Pakistani traders. Avoid trading during low liquidity hours.
Create a checklist for every trade. Before entering, verify price is at a key level. Confirm you have a signal. Check that risk-reward meets your minimum. Ensure your stop loss is logical.
Review your plan monthly. Look at what works and what does not. Adjust your rules based on results. Keep what works, remove what does not. Continuous improvement leads to long-term success.
FAQ
Draw only 2 to 4 key levels per chart. Focus on the most obvious zones where price has reacted strongly multiple times. Too many lines create confusion and make trading decisions harder. Quality matters more than quantity when marking levels.
Yes, support and resistance work on all timeframes from 1-minute to monthly charts. However, higher timeframes like daily and weekly provide stronger and more reliable levels. Start your analysis on higher timeframes, then move to lower ones for entry timing.
Zones work better than exact lines. Markets are not precise, and price often spikes through levels by a few pips before reversing. Use zones that are 10 to 20 pips wide to account for this natural market behavior.
Aim for at least 1 to 2 risk-reward ratio. This means your profit target should be at least twice the distance of your stop loss. With this ratio, you can win less than half your trades and still make money overall.
Wait for at least one candle to close in your direction. On a 1-hour chart, wait one hour. On a 4-hour chart, wait four hours. This confirms the level is holding and reduces false signals that can stop you out quickly.
No, support and resistance work in both ranging and trending markets. In ranging markets, trade bounces from the range boundaries. In trending markets, focus on pullbacks to support in uptrends or resistance in downtrends.
When a level breaks with strong momentum and closes beyond it, that level often becomes the opposite. Old support becomes new resistance and old resistance becomes new support. Wait for a retest of the broken level before entering new trades.
Real breakouts close beyond the level with increased volume and strong momentum. Fake breakouts spike through then quickly reverse. Wait for a candle to close beyond the level, then look for a retest before entering.
Conclusion
Support and resistance trading gives you a simple and powerful way to analyze markets. You can identify where prices are likely to reverse or break out. This helps you make better trading decisions with clear entry and exit points.
Start by mastering the basics on a demo account. Practice drawing levels on major currency pairs. Take only bounce trades until you feel confident. Then add breakout trades to your strategy.
Remember that no strategy wins every time. You will have losing trades. Proper risk management protects your account during losses. Focus on executing your plan consistently rather than chasing quick profits.
Keep learning and refining your approach. Watch how price reacts at your levels over time. Join trading communities to learn from experienced traders. Check our daily free signals to see how professionals trade support and resistance levels.
Support and resistance trading is a skill that improves with practice. Give yourself time to develop. Stay patient and disciplined. With consistent effort, you will start seeing opportunities that others miss. Your trading will become more confident and profitable over time.