
You see those diagonal lines traders draw on charts? Trendlines. They look simple. Almost too simple. Trendline trading helps you read these moves the right way.
But here’s what nobody tells you. Most profitable traders rely on trendlines more than any indicator. Why? They show you exactly where price wants to go before it gets there.
This guide teaches you how to draw trendlines correctly, spot high probability setups using trendline trading, and avoid the mistakes that trap beginners. Everything you learn works on gold, EUR/USD, or any pair you trade during Pakistan evening hours.
Our complete forex trading guide covers technical analysis basics. Check daily free signals to see how we use trendlines in real trades.
What Actually Is Trendline Trading
A trendline is a diagonal line connecting price points on your chart. Simple as that.
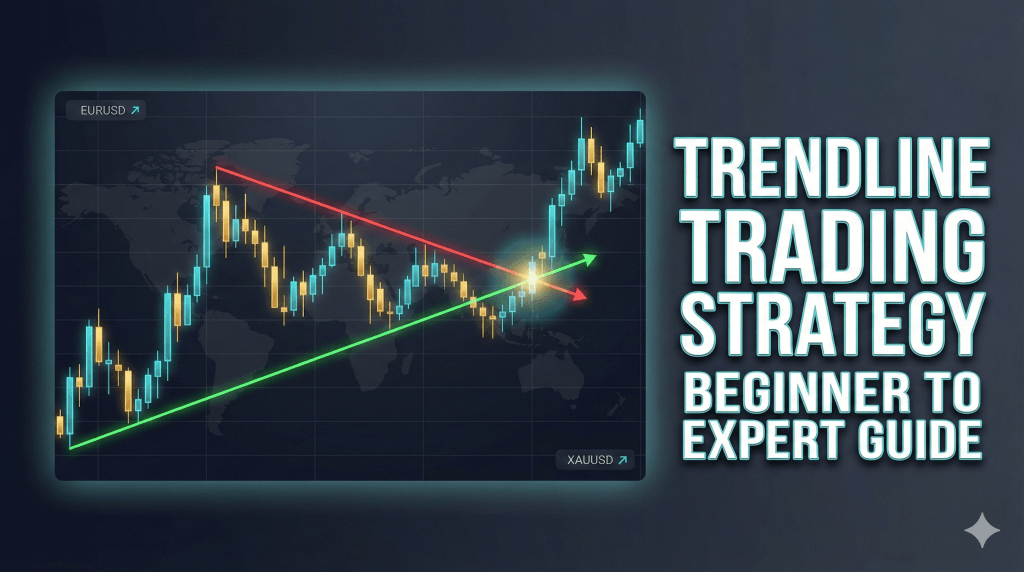
In uptrends, you draw lines under price connecting the lows. In downtrends, you draw lines above price connecting the highs. These lines show where buyers or sellers keep stepping in.
Think about it like this. Price hits a level once. Could be random. Hits the same level twice? Interesting. Three times? Now you have a pattern. That’s your trendline.
The beauty of trendlines? They work everywhere. Stocks. Forex. Crypto. Doesn’t matter. Human psychology drives all markets the same way.
Why Pakistani Traders Need This Skill
You’re trading gold at 8 PM Pakistan time. Price is bouncing around. Where do you enter? Where do you place stops?
Trendlines answer these questions instantly.
They show you market direction at a glance. No need for ten indicators cluttering your screen. One clean diagonal line tells you if price is trending or breaking structure.
For Pakistani traders working day jobs, trendlines save time. Mark your lines on Sunday. Set alerts. When price hits during evening session, you know exactly what to do.
Plus, trendlines improve your support and resistance trading. Horizontal levels show where. Diagonal trendlines show when.
How to Draw Trendlines Correctly
Most beginners mess this up. They draw lines everywhere until their charts look like spider webs. Total chaos.
Here’s the right way.
Step One: Zoom Out Your Chart
Pull back to see at least 100-150 candles. You want perspective. Too zoomed in makes you draw lines at every tiny move.
On 4 hour charts, this shows you several weeks of price action. Perfect for identifying real trends versus noise.
Step Two: Find Obvious Highs and Lows
Look for clear swing points where price reversed sharply. Don’t hunt for every little bump. Just the obvious ones that jump out at you.
In uptrends, mark the major lows. In downtrends, mark the major highs. These become your anchor points.
Step Three: Connect Two Points
Take your line tool. Connect the two most obvious swing points. That’s your initial trendline.
Don’t force it. If you’re debating whether a point counts, it probably doesn’t. The best trendlines are obvious to everyone looking at the chart.
Step Four: Adjust for Maximum Touches
Now tweak your line slightly to catch more price touches. You want the line touching as many candles as possible without cutting through candle bodies.
Wicks can pierce through. That’s fine. Bodies should respect the line. This gives you the cleanest trendline.
Some traders use body closes only. Others include wicks. Test both and see what works for your style.
The Three Touch Rule Everyone Ignores
First touch doesn’t mean anything. You can’t even draw a trendline yet.
Second touch creates the line. Now you have something to watch.
Third touch? That’s your trade signal.
Think about this logically. Markets tested the line twice already. Both times price bounced. Third time shows the level is proven. Traders are watching it. Orders cluster there.
Your best entries come at that third touch. Maybe fourth or fifth if the trend is really strong. But never trade the first or second touch. You’re just guessing then.
I’ve watched traders lose money for years because they jump in too early. They see two touches and think “this is it.” Then price breaks through. That trendline wasn’t confirmed yet.
Wait for three. Be patient. Your account will thank you.
Drawing Trendlines in Uptrends
Uptrends make higher highs and higher lows. Your job? Connect those higher lows with a diagonal line sloping upward.
Find the lowest point in recent price action. That’s touch one. Next time price pulls back but stays above the first low? Touch two. Draw your line.
When price pulls back the third time toward your line, you’re watching for a bounce. That’s your buy signal.
Place stop loss below the trendline. Maybe 10-15 pips below for gold. This protects you if the trend breaks.
Target? Next resistance level or previous high. You’re riding the trend until it shows signs of ending.
For price action trading, look for bullish candle patterns at your trendline. Pin bars. Engulfing candles. These confirm the bounce.
Drawing Trendlines in Downtrends
Downtrends make lower highs and lower lows. Connect those lower highs with a line sloping downward.
Find the highest point in recent price action. Touch one. Next rally stops below the first high? Touch two. Draw your line.
Third time price rallies toward your trendline, you’re looking to sell. That’s your short entry.
Stop loss goes above the trendline. 10-15 pips buffer for normal price movement. If price breaks above, your trend is over.
Target the next support level or previous low. Let the downtrend work for you.
Best Timeframes for Pakistani Traders
The 4 hour chart is your sweet spot. Why?
It filters out noise from smaller timeframes. You see clean swings without getting chopped up by every tiny move. Perfect for traders checking charts twice daily, morning and evening.
Daily charts work for swing trades you hold several days. Good for identifying major trend direction. But sometimes you wait too long for setups.
1 hour charts give you more trade opportunities. Just watch out for false breakouts. Price gets choppier here.
I don’t recommend anything under 1 hour for trendline trading. 15 minute and 5 minute charts have too much random movement. Your trendlines break constantly, even when the real trend stays intact.
Start with 4 hour. Once you’re profitable there, experiment with other timeframes. But 4 hour should be your foundation.
The London and New York sessions from 5 PM to 9 PM Pakistan time show the cleanest trendline respect. High volume means price follows structure better. Asian session overnight gets messy.
Trendline Break Trading Strategy
Sometimes the trend ends. Price breaks through your trendline. This signals potential reversal.
But here’s the trick. Don’t jump in immediately when a trendline breaks. Wait for confirmation.
How to Trade Trendline Breaks
Price breaks below an uptrend line. Don’t sell yet. Wait for price to retest that broken line from below. The old support becomes new resistance.
When price rallies back to test the broken trendline and gets rejected? That’s your sell signal. Now you have confirmation the trend changed.
Same thing works in reverse. Downtrend line breaks to upside. Wait for retest from above. Buy when price respects the broken line as new support.
Your stop loss goes on the opposite side of the trendline. If you’re buying after an upside break, stop goes below the line. Selling after downside break? Stop above the line.
False breaks happen all the time. Price spikes through, triggers stops, then reverses back into the trend. The retest strategy keeps you out of these traps.
Common Trendline Mistakes That Cost Money
Drawing too many lines is mistake number one. Your chart looks like abstract art. Which line matters? You have no idea.
Keep it simple. One or two clear trendlines maximum. If you need more than that, you’re probably forcing lines where they don’t exist.
Mistake two? Adjusting your trendline after it breaks. Price breaks through, but you move the line to make it fit again. Stop doing this.
When a trendline breaks, accept it. The trend changed. Draw a new line if a new trend forms. Don’t keep adjusting the old one to match your bias.
Trading without waiting for three touches. We covered this already but it bears repeating. Two touches isn’t enough. You need that third confirmation.
Placing stops too tight. Yes, stops go beyond your trendline. But give it breathing room. Markets make fake moves that hit tight stops before reversing.
For gold, I use 10-15 pip buffer. EUR/USD maybe 8-10 pips. Adjust based on pair volatility and your timeframe.
Combining Trendlines with Support Resistance
This is where magic happens.
You have a horizontal support level at 2580 on gold. Price tested it multiple times. Strong level.
You also have an uptrend line connecting higher lows. That trendline converges with your 2580 support.
When price reaches this zone where trendline meets horizontal support? Super high probability buy setup. Two reasons to bounce instead of one.
Same logic works with resistance. Trendline meeting horizontal resistance creates a power zone for selling.
Always look for confluence. Multiple factors agreeing on the same price level. These setups have the best risk reward ratios.
Check TradingView charts to practice finding these confluences. Mark both horizontal and diagonal levels.
Trading Trendline Bounces vs Breaks
Bounce trades work with the trend. Lower risk. Higher probability. Smaller potential profit per trade.
Break trades catch reversals. Higher risk. Lower probability. Massive potential profit when you time them right.
Which should you trade?
Depends on market conditions and your personality.
During strong trends like we see in gold recently, bounces dominate. The trend keeps going. Breaks fail and price continues trending. Focus on buying dips in uptrends or selling rallies in downtrends.
When markets get choppy and rangebound, breaks work better. Trends keep failing. Price keeps reversing. You catch those reversals with break trades.
Most professional traders do both. They just know when to use each strategy.
Strong trending market? Trade bounces. Choppy market? Trade breaks. Simple as that.
Position Sizing for Trendline Trades
Your trendline gives you a natural stop loss location. Just beyond the line. This makes position sizing easy.
Let’s say you’re buying gold at 2585 where price touches an uptrend line. Your stop loss goes at 2575, ten pips below the line.
You have 50,000 PKR account. You risk 1% per trade. That’s 500 PKR maximum risk.
Your stop is 10 pips. Divide 500 PKR by 10 pips. You can risk 50 PKR per pip. At current gold pip values, this works out to 0.05 lots roughly.
Use position size calculators to get exact numbers. Never guess at position sizing.
The tighter your stop (closer to the trendline), the bigger position you can take for the same risk percentage. But don’t make stops too tight just to increase size. That’s how you get stopped out constantly.
Best Pairs for Trendline Trading
Gold trends beautifully. Those long smooth moves make trendlines obvious. Perfect for beginners learning this strategy.
EUR/USD trends well during major moves. When dollar or euro has strong directional bias, trendlines work great.
GBP/USD is choppier. Still tradeable but needs wider stops. Price makes more false moves through trendlines before resuming trend.
Bitcoin trends strong when it moves. But volatility is extreme. Use smaller position sizes. Stops need to be much wider.
Silver trends like gold but with way more volatility. Experienced traders love it. Beginners should stick with gold first.
For Pakistani traders, focus on instruments active during 5 PM to 9 PM your time. That’s when London and New York trade. Volume is high. Trendlines work best.
Our best trading platforms guide helps you find brokers with tight spreads on these pairs.
How to Practice Trendline Trading
Open a demo account. Your broker offers free demo with virtual money. Use it.
Go back in your charts six months. Hide the right side so you can’t see future price. Now walk forward candle by candle.
Draw trendlines when you see trends forming. Mark your entry points at third touches. Place stops beyond the line. See what happens.
Do this for 50 trades minimum. Record everything. Win or lose, what happened? Did you wait for three touches? Did you give enough buffer on stops?
After 50 backtested trades, you’ll see patterns in what works for you. Maybe 4 hour gold trendlines work great but 1 hour EUR/USD keeps failing. Good. Now you know where to focus.
Only after profitable demo trading should you risk real money. Start small. Use 10,000 to 20,000 PKR. Trade micro lots. Build confidence before increasing size.
Most traders skip this practice phase. They jump straight to real money and lose it all within weeks. Don’t be that trader.
Real Trade Example: Gold Uptrend
Let me walk you through a real gold trade using trendlines.
Gold was trending up from 2520 to 2640 over two weeks. Clear higher lows forming at 2530, then 2555, then 2575.
I drew an uptrend line connecting these three lows. Perfect trendline. Three clean touches.
Price rallied to 2640, then pulled back toward my trendline. This is touch number four. I’m watching for a bounce.
Price hits 2578, right on my line. A bullish pin bar forms on the 4 hour chart. Wick reaches 2575, body closes at 2585. Clear rejection of the trendline.
I buy at 2586 when next candle opens. Stop loss at 2570, six pips below the trendline. My risk is 16 pips.
First target sits at 2620, previous resistance. That’s 34 pips profit. Risk reward of 1 to 2.
Price bounces from my trendline and rallies to 2625 over the next day. I close at 2620 for +34 pips. Perfect trendline trade.
Total risk was 16 pips. Profit was 34 pips. Clean 1 to 2 risk reward. This is how trendline trading works when you follow the rules.
Managing Open Trendline Trades
Once you’re in a bounce trade, trail your stop along the trendline. As price makes new higher lows in an uptrend, move your stop up to stay below the line.
This protects profit if price suddenly reverses. You never give back all your gains.
For break trades, don’t trail as aggressively. The new trend needs room to develop. Let it breathe.
Take partial profits at logical resistance levels. If you bought at trendline support and price rallies to horizontal resistance, close half your position. Lock in profit.
Let the other half run with a trailed stop. Sometimes price keeps going way beyond your initial target. Partial profit taking captures both scenarios.
Never hold through a trendline break if you’re trading bounces. Your setup is invalidated. Exit immediately. The trend changed. Don’t hope it comes back.
When Trendlines Stop Working
Choppy markets kill trendlines. When price is stuck in a tight range bouncing sideways, trendlines break constantly.
During these periods, switch to horizontal support resistance trading. Wait for clearer trending conditions before using trendlines again.
Major news events can smash through trendlines instantly. Price gaps through your line before you can react. This is why you always use stop losses.
Check Forex Factory calendar for high impact news. Avoid holding trendline trades through major releases like NFP, interest rate decisions, or CPI data.
Very low timeframes (under 1 hour) show too much noise. Trendlines break and reform constantly. Stick to higher timeframes where structure holds better.
Advanced Trendline Concepts
Channel trading uses two parallel trendlines. Draw your main trendline connecting lows in an uptrend. Then copy it and place the copy touching the highs.
Price oscillates between these two lines. Buy near the lower line. Sell near the upper line. Simple range trading within a trending channel.
Multiple timeframe trendlines add confirmation. Your daily chart shows an uptrend line. Your 4 hour chart shows an uptrend line. When both align at the same price zone, that’s a power setup.
Trendline angles reveal trend strength. Steep trendlines (over 45 degrees) show aggressive trending but break easily. Shallow trendlines (under 30 degrees) show weak trends that often consolidate.
The ideal angle sits around 30-45 degrees. Sustainable trending that can continue for weeks or months.
Mental Game of Trendline Trading
Patience is everything. You might wait days for price to reach your trendline. Don’t force trades. Wait for your setup.
When you finally get your trendline touch and take the trade, trust your stop loss. Don’t move it. Don’t second guess. You did the analysis. Now let it play out.
Losing trendline trades are normal. Even the best traders only win 50-60% of their trendline setups. You win by keeping losses small and letting winners run.
After a loss, review what happened. Did you wait for three touches? Was your stop placement logical? Did you honor your rules?
If you followed your rules and still lost, that’s just trading. Move on to the next setup. If you broke your rules, identify why and fix it before trading again.
Building Your Trendline Trading System
Start simple. Pick one pair. Gold works great. Use only 4 hour charts.
Your rule: Only trade third touches of confirmed trendlines. Stops go 10-15 pips beyond the line. Targets are previous swing highs or lows.
Risk 1% per trade. Use proper position sizing every time. Keep a journal recording every trade.
After 50 trades, review your stats. What’s your win rate? Average winner versus average loser? Are you following your rules consistently?
Adjust based on data, not feelings. If 4 hour works well but 1 hour keeps failing, drop 1 hour. If gold trends better than EUR/USD for you, focus on gold.
Your system evolves based on real results. After six months, you’ll have a refined trendline strategy that matches your personality and schedule.
FAQ About Trendline Trading
How many touches confirm a trendline
Three touches minimum. First two points create the line. Third touch confirms it as a valid level that price respects. Never trade the first or second touch. Wait for the third.
Can I trade trendlines on 15 minute charts
You can, but it’s harder. Lower timeframes show more noise and false breaks. Start with 4 hour charts to learn properly. After you’re profitable there, experiment with lower timeframes if you want.
What if price breaks my trendline
Exit immediately if you were trading the bounce. Your setup is invalidated. The trend changed or is pausing. Wait for a new trendline to form or look for a break trade going the opposite direction.
Should I use body closes or wicks for trendlines
Both work. Some traders use only body closes. Others include wicks. Test both and see what gives you better results. Consistency matters more than which method you choose.
How long do trendlines stay valid
Until they break. A trendline can work for weeks or months if the trend stays strong. Keep respecting it until price closes beyond the line with conviction. Then you know it’s over.
What stop loss size should I use
Place stops 10-15 pips beyond your trendline for gold. Adjust based on pair volatility and timeframe. Higher timeframes need wider stops. More volatile pairs need wider stops. Always give enough room for normal price movement.
Your Next Steps
Open your charts right now. Pick gold on the 4 hour timeframe. Zoom out to see 150 candles.
Find the obvious trend. Draw one trendline connecting the major highs or lows. Just one line. Not five. One.
Mark where the third touch occurred. Did price bounce? What happened next? Do this for several historical trends.
You’ll start seeing patterns. Trends respect lines multiple times before breaking. Third touches often provide the best risk reward. Breaks need confirmation before trading.
After analyzing ten historical trends, move to demo trading. Draw your lines. Wait for setups. Take trades with proper stops and targets. Record results.
This practice separates traders who understand trendlines from those who just draw random lines hoping something works.
Trendline trading is simple. Not easy. But simple. Master this one skill and your trading transforms. You see market structure clearly. You know where to enter and where to exit. You trade with confidence instead of hope.
Start today. One trendline. One timeframe. One pair. Build from there.
Risk Warning: Trading involves substantial loss risk. Use proper risk management and never risk money you cannot afford to lose. This is educational content, not financial advice.
Related Guides:
- Complete Forex Trading Guide for Pakistani Traders
- Support and Resistance Trading Strategy
- Price Action Trading Guide
Last Updated: December 6, 2025